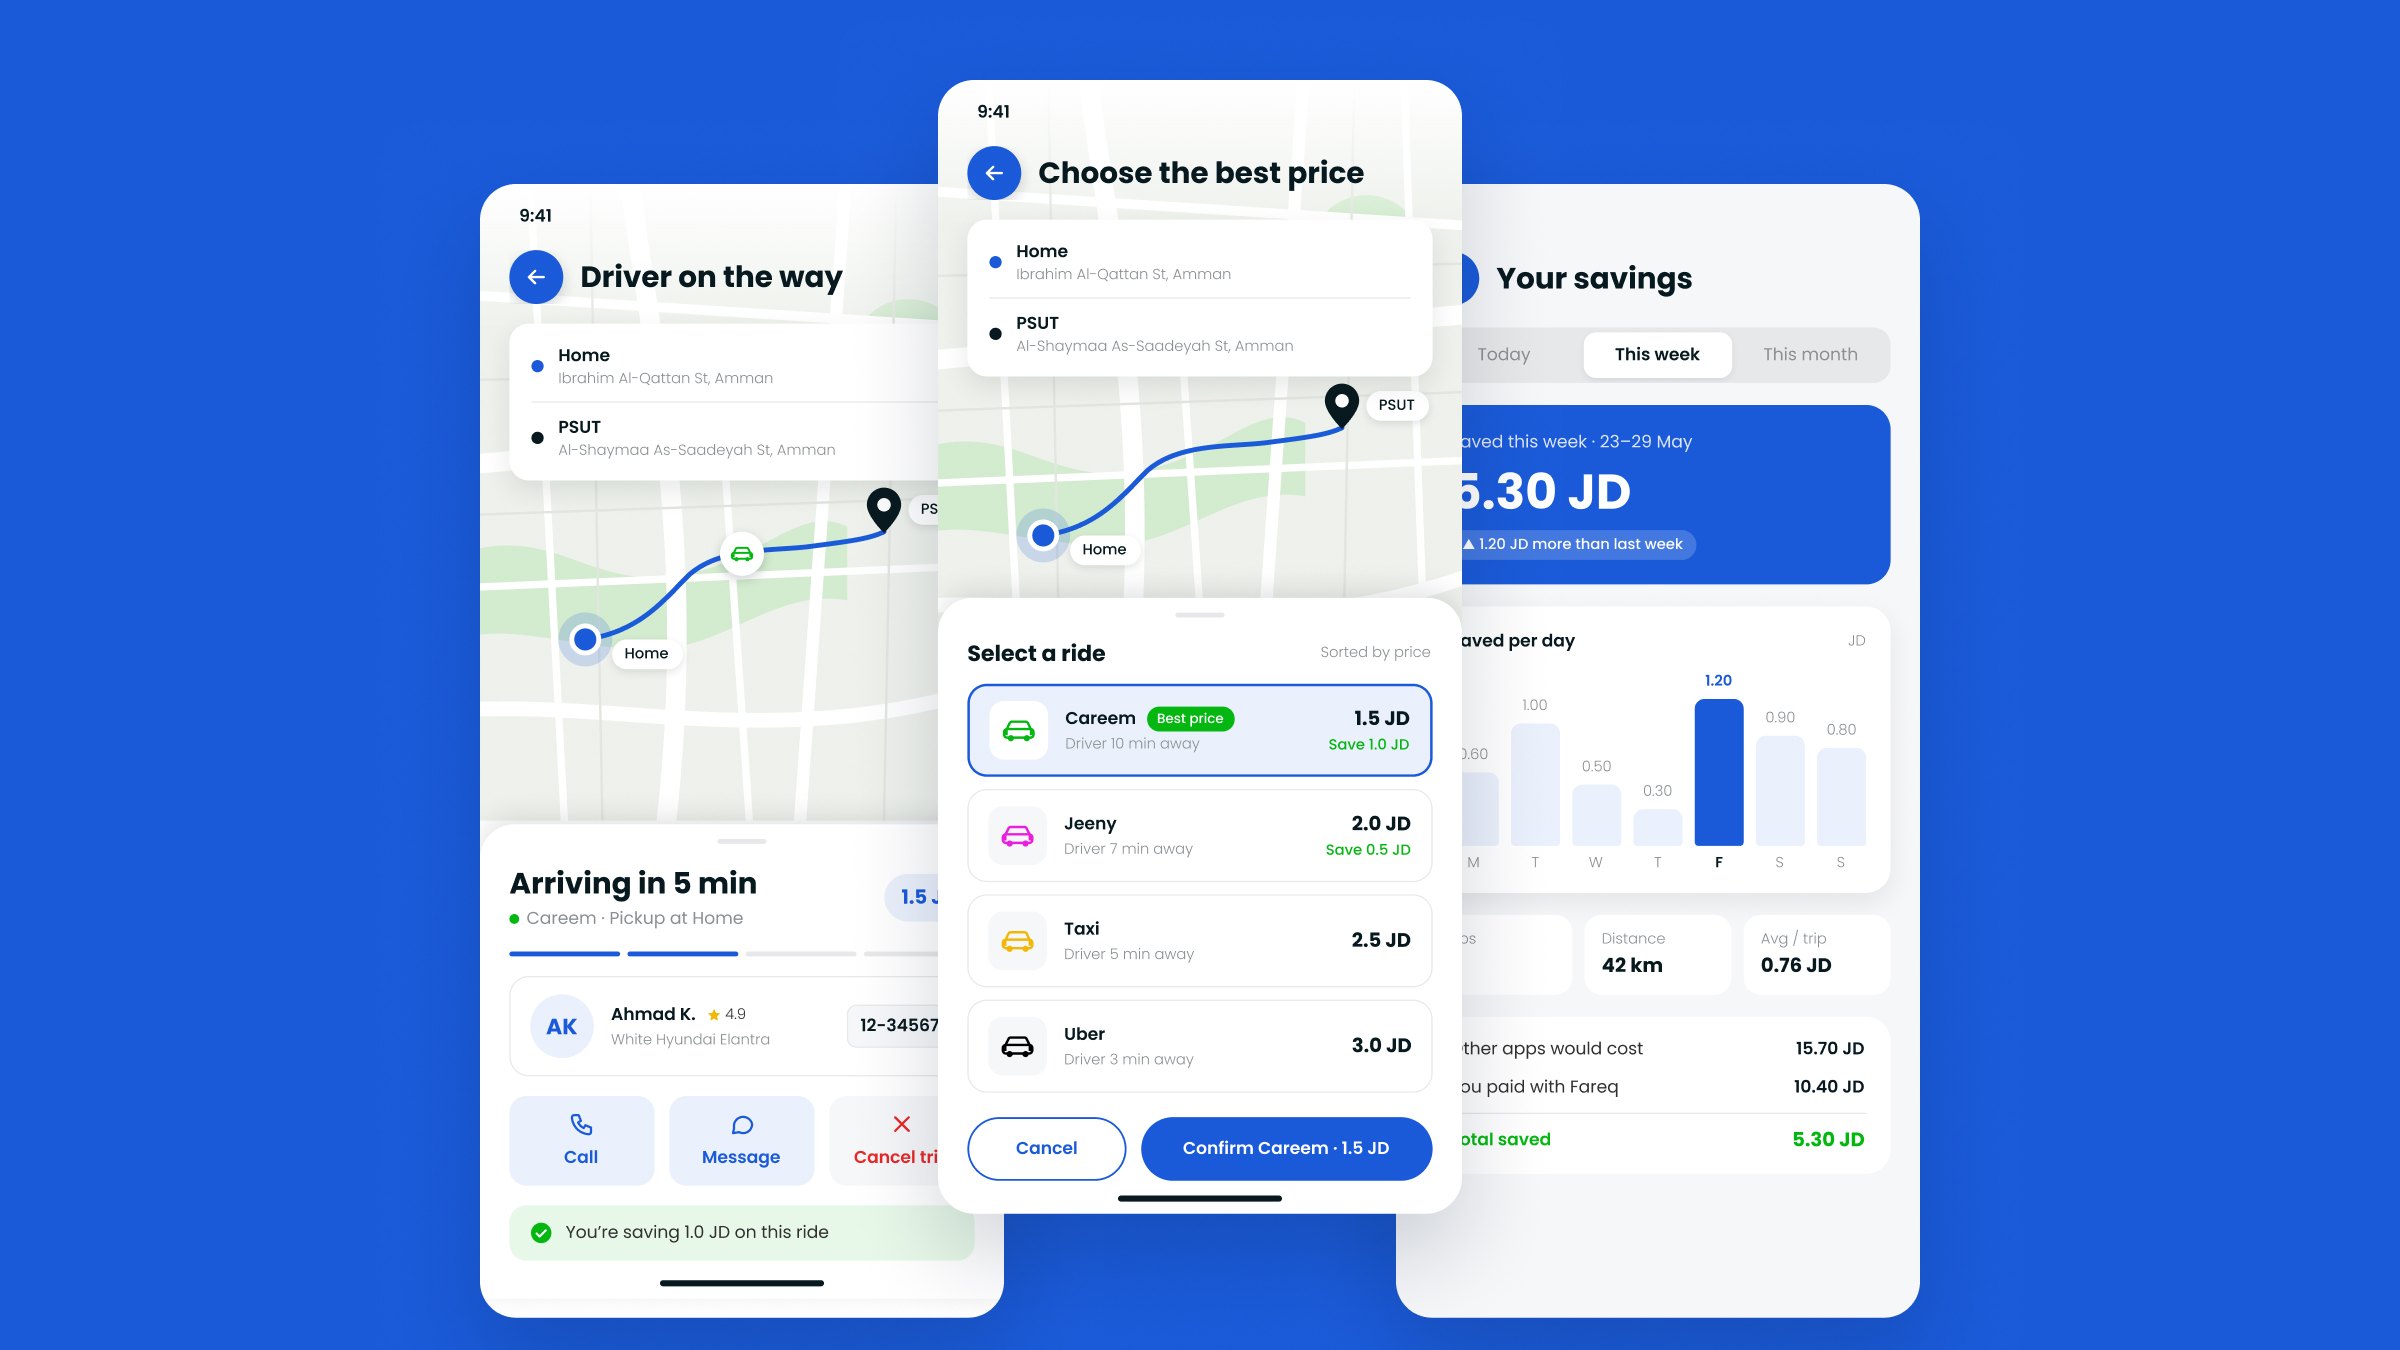
Overview
Fareq (فارق, “the difference”) compares Careem, Uber, Jeeny and taxi prices for the same trip in Amman, lets you book the cheapest one, and keeps track of how much you have saved.
The project came to me through a faculty member at PSUT, on behalf of an external client. I designed the whole app in Adobe XD: the ride flow from login to rating, the visual style, and several layout options for the most important screens. For this portfolio I went back to it and redesigned the three key screens in Figma, then extended them into a 7-step clickable flow, from choosing a destination to rating the trip.
Where it started: the XD design
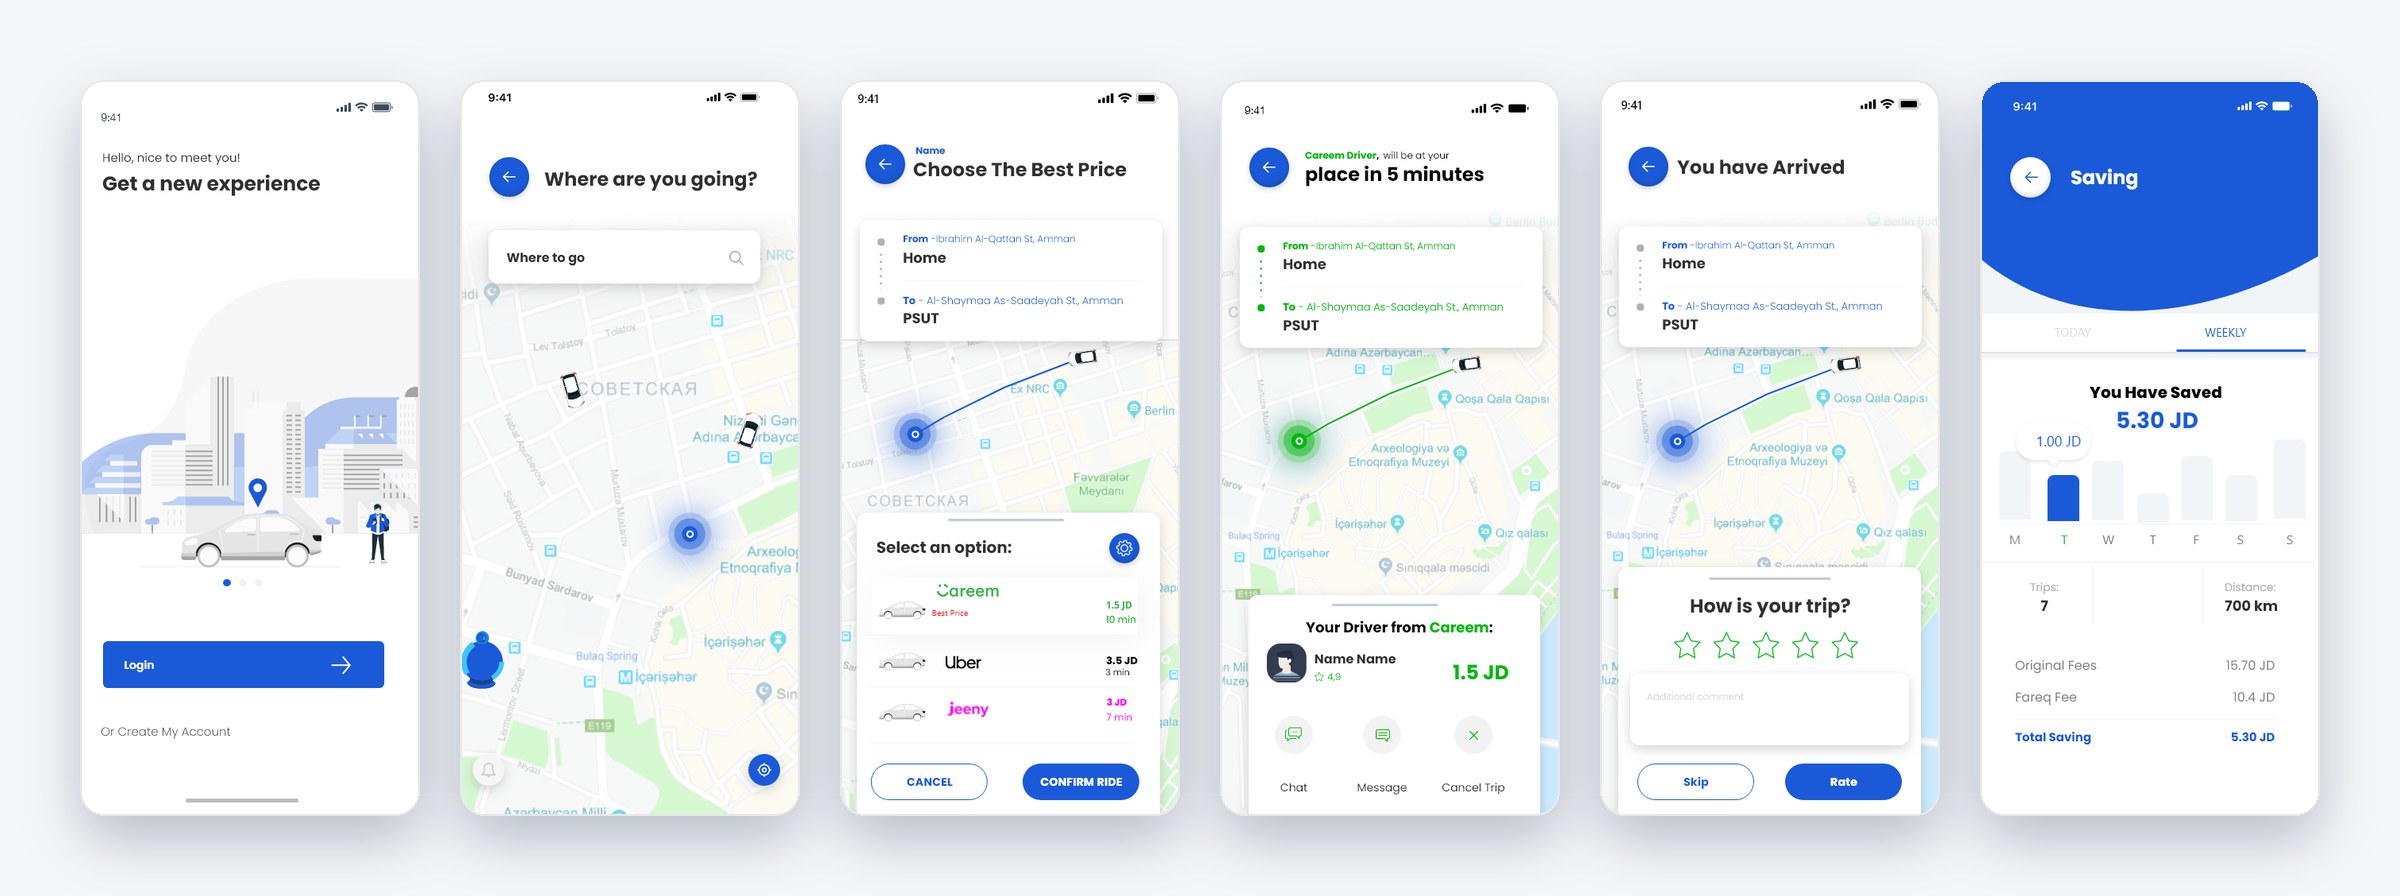
The flow was complete and the visual style was clear. Looking at it again, I found a few things I'd now do differently:
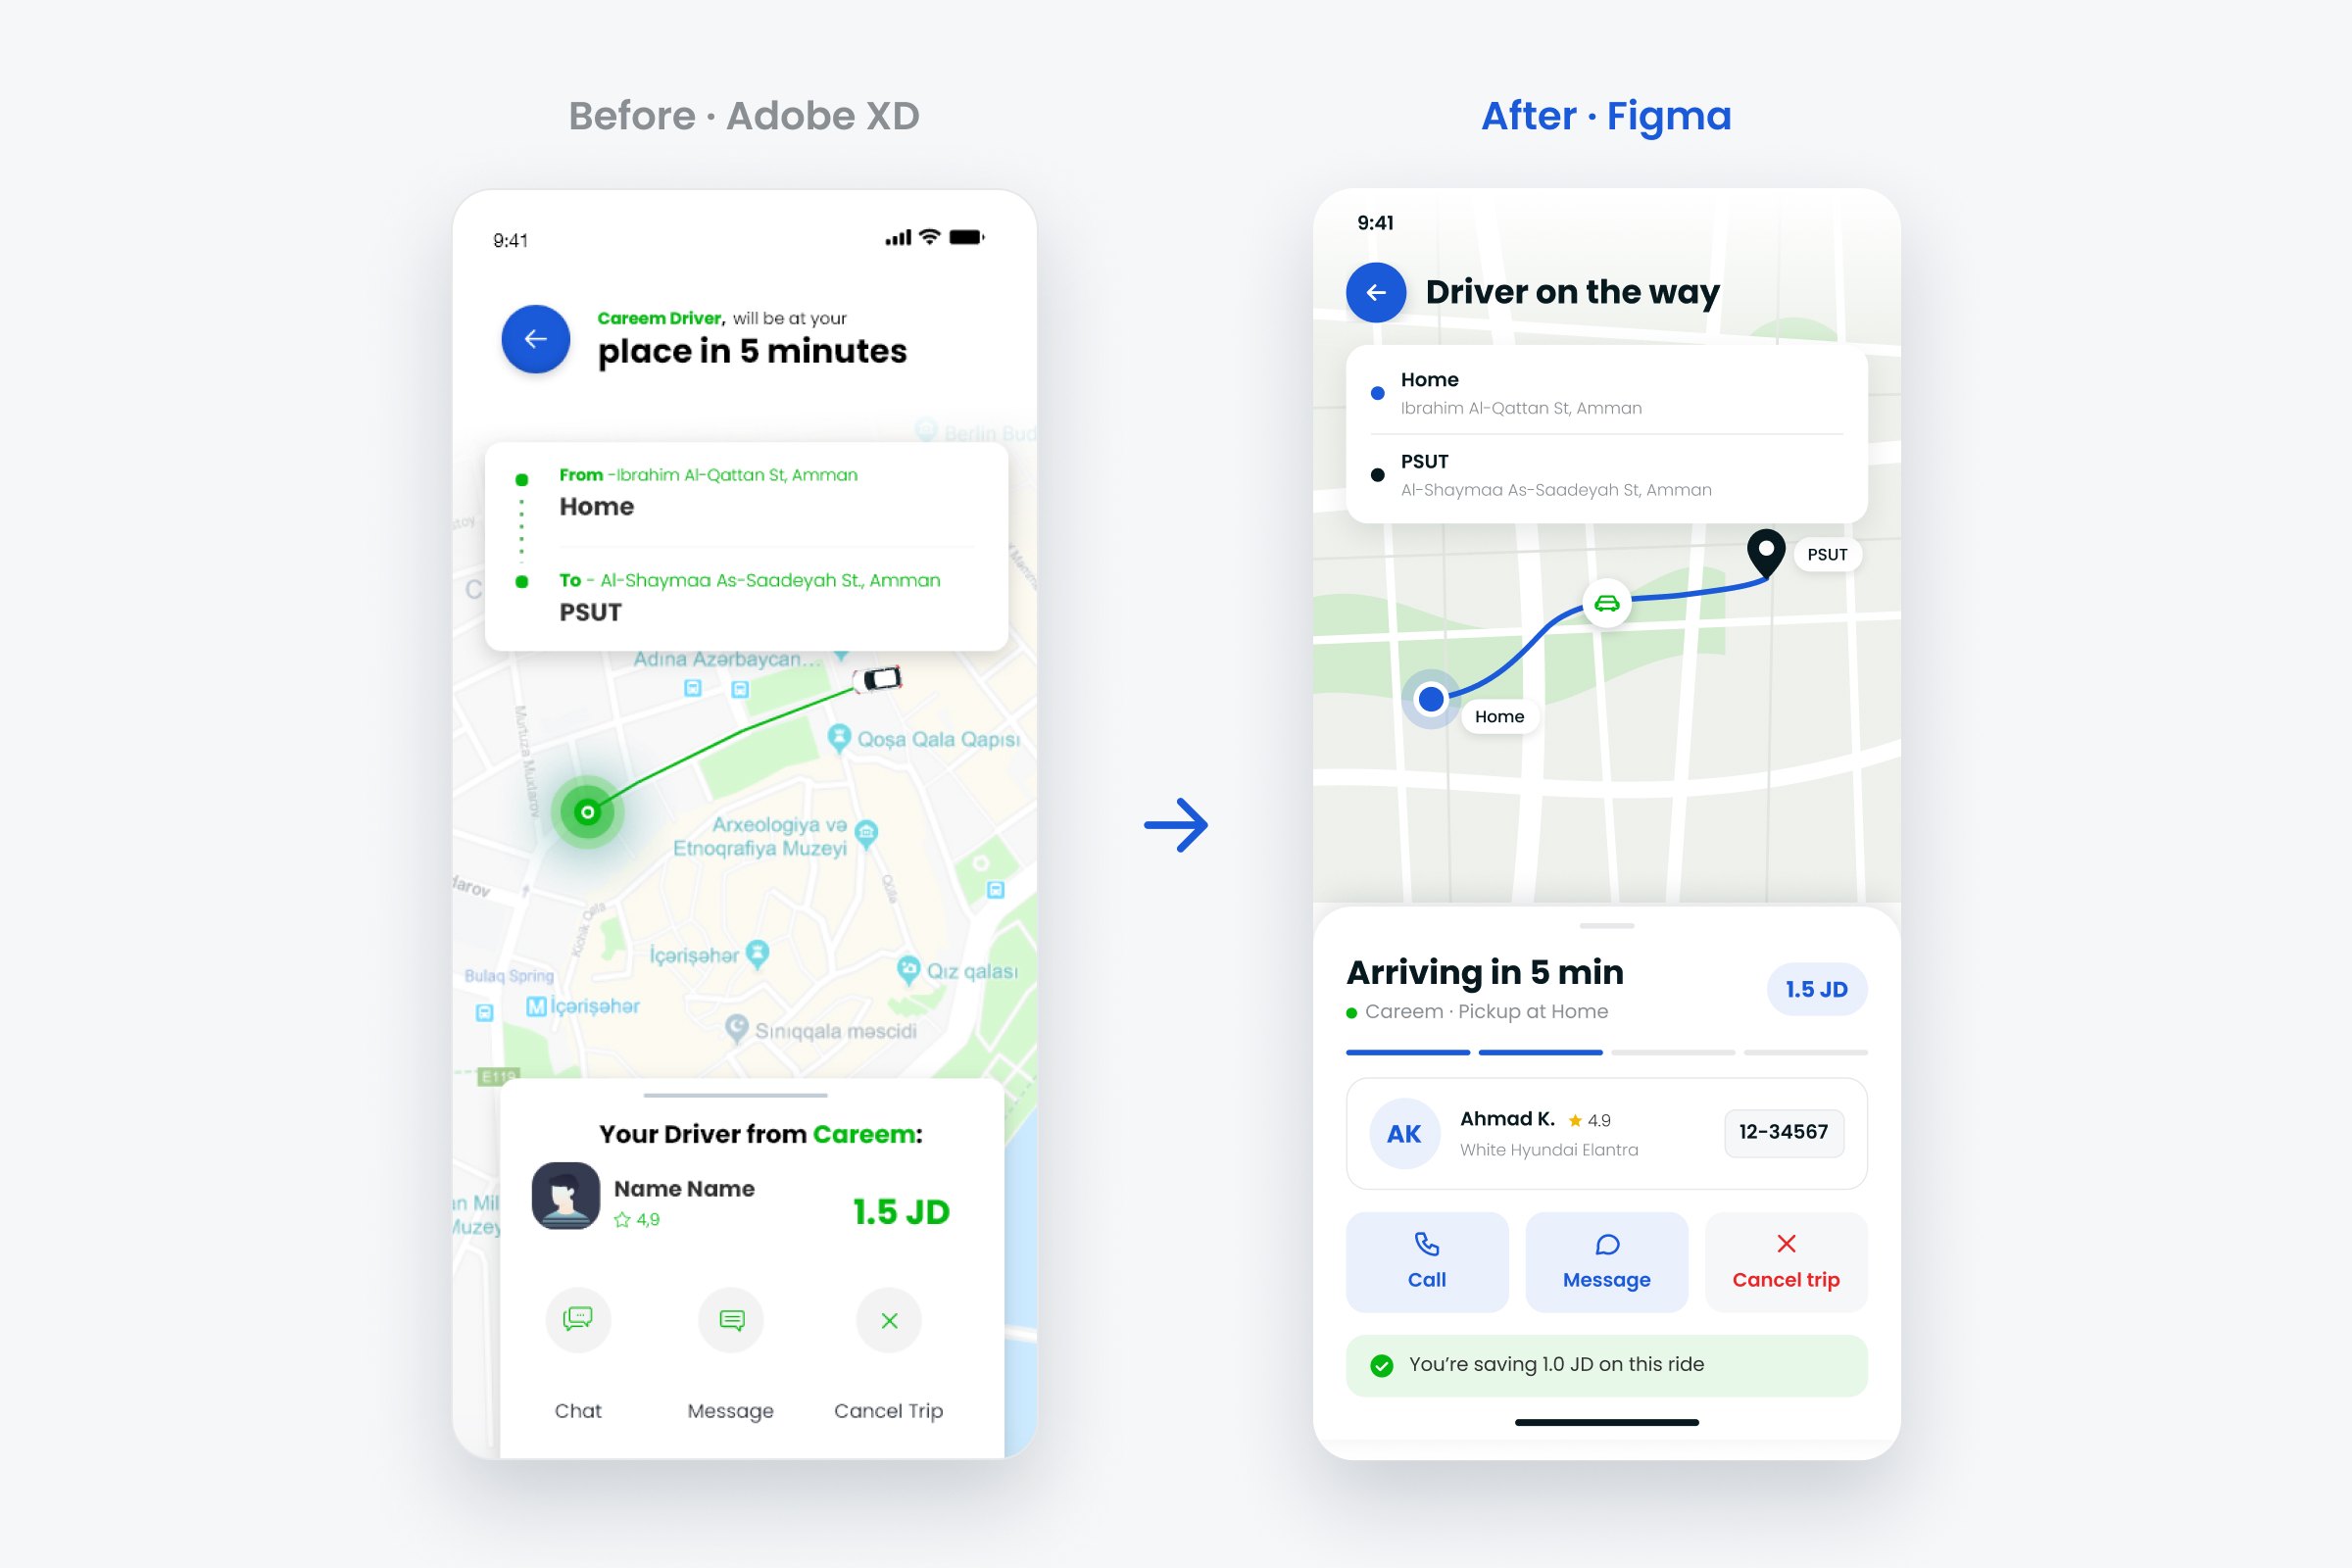
- Placeholder content“Name”, “Lorem ipsum”, a $9.99 price in a JD app, and a map of another city behind Amman addresses.
- The saving came lastSaving money is the whole point, but riders only saw it after the trip ended.
- Two buttons that did the same thing“Chat” and “Message” sat side by side on the driver screen.
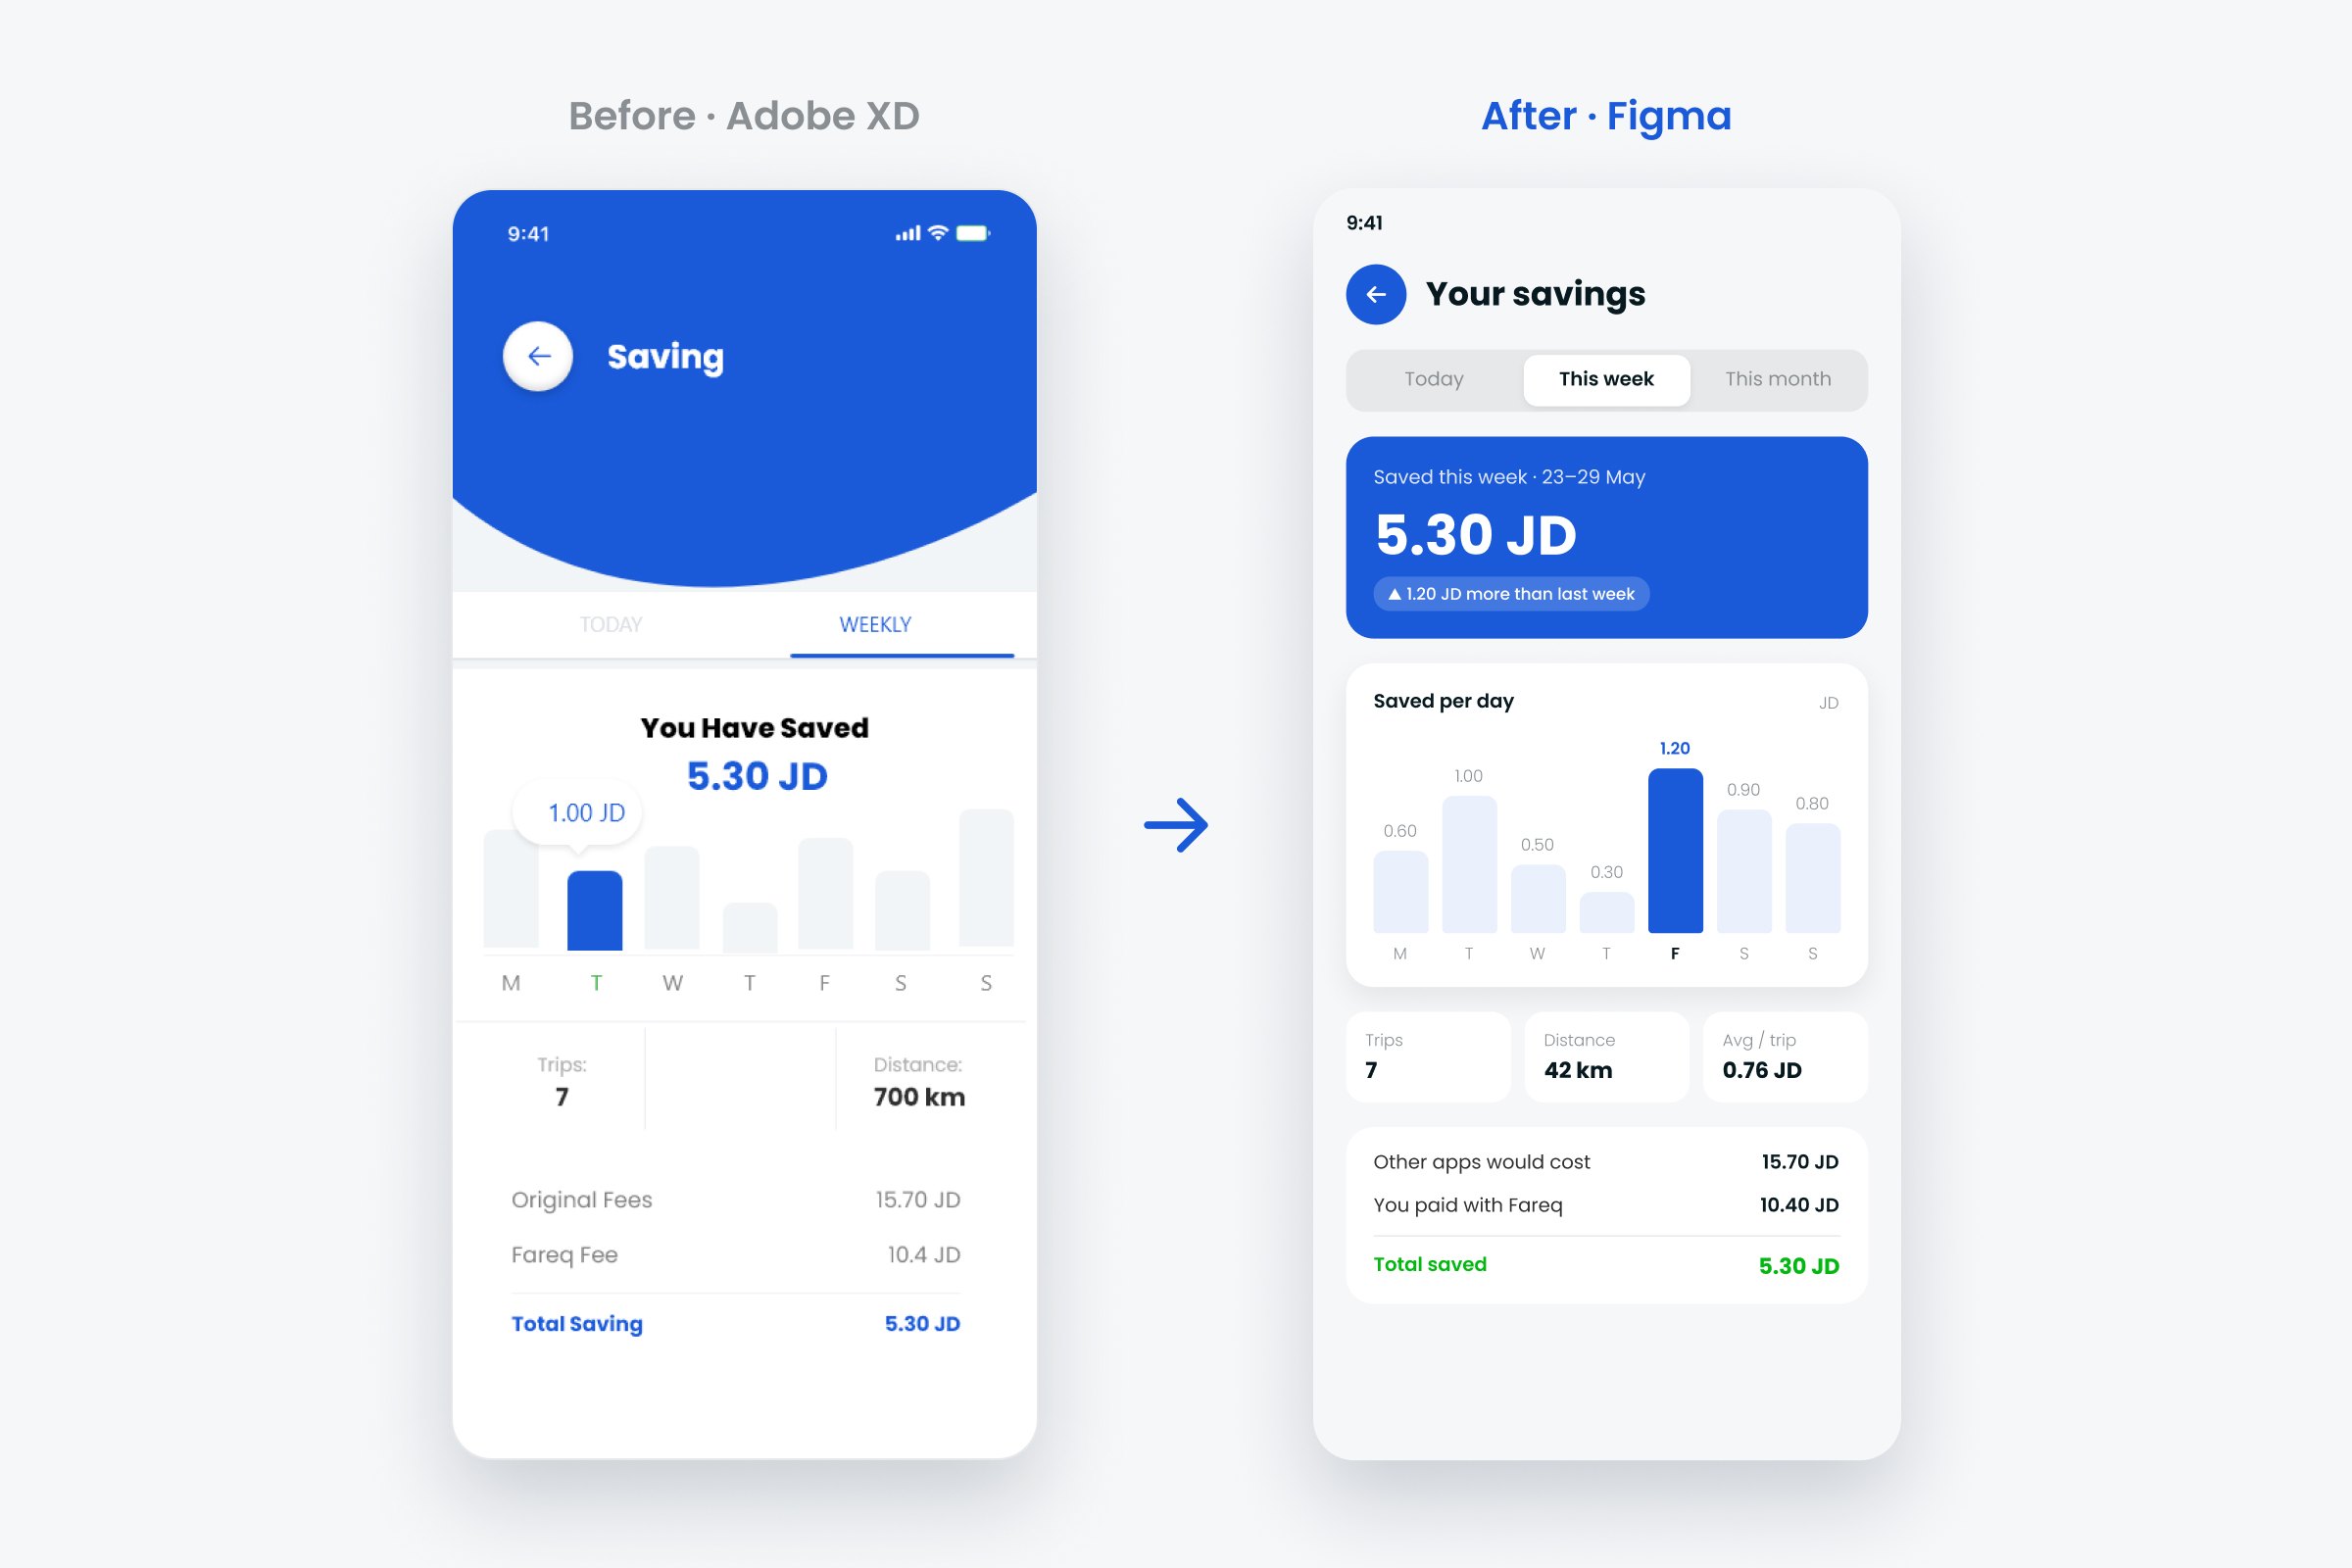
- A confusing label“Fareq fee” read like an extra charge, when it was really the price you paid.
- Unrealistic numbers7 trips around Amman added up to 700 km.
The problem
In Amman, the same trip can cost noticeably different amounts on Careem, Uber, Jeeny or a regular taxi, and the prices change with the time of day and demand. Finding the cheapest one means opening each app, entering the same trip, and comparing in your head. The client wanted one app that does that comparison for you.
Goals
Compare at a glance
Every option on one list, in the same format, so the cheapest is obvious in a second.
Show the saving
The money saved should be visible before, during and after the ride, not only at the end.
Ride with confidence
Riders should always know who is coming, in which car, and when.
How I worked
- Map the ride flowLogin to rating, eight steps
- Design every screen in XD38 screens in total
- Explore the key screensFour layouts for the price picker
- Review with fresh eyesWhat to keep and what to fix
- Redesign in FigmaVariables, text styles, components
The flow
Exploring the price picker
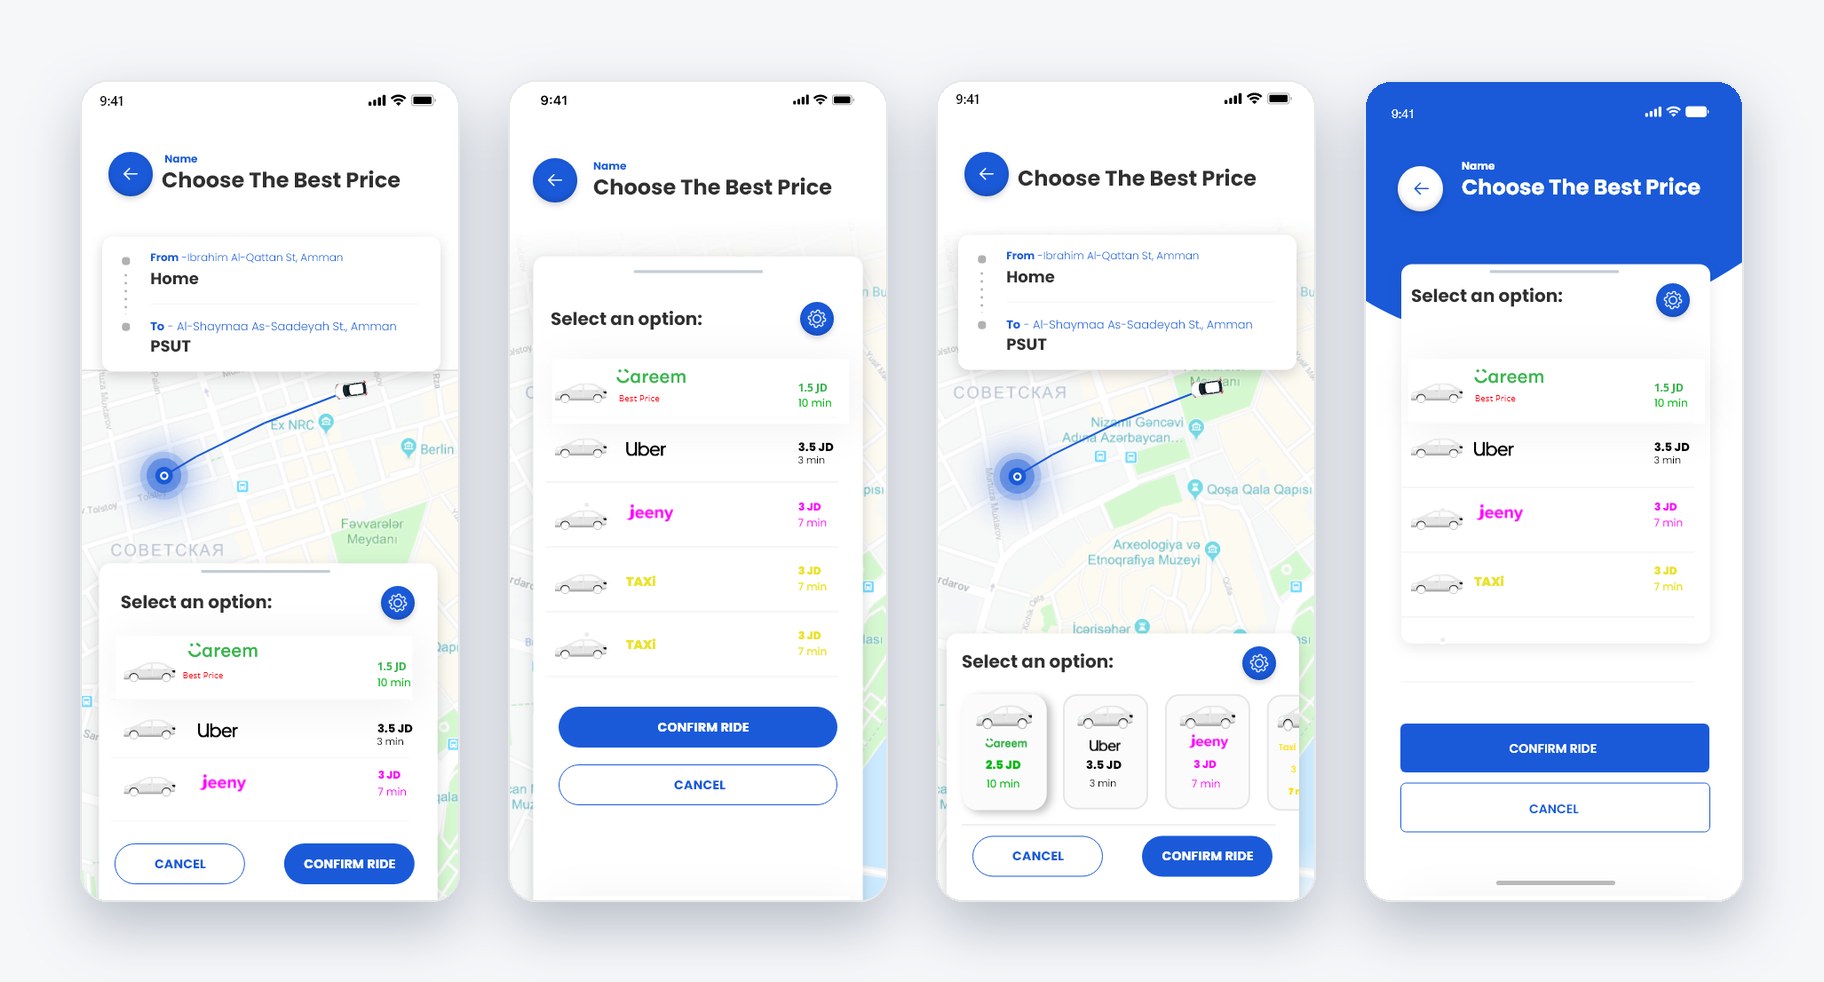
The price picker is the most important screen in the app, so I tried it the most ways. Cards looked friendly but only fit three options and made prices harder to compare. A list kept every price in one column, easy to scan, and still left room for the map, so the redesign builds on it.
Key design decisions
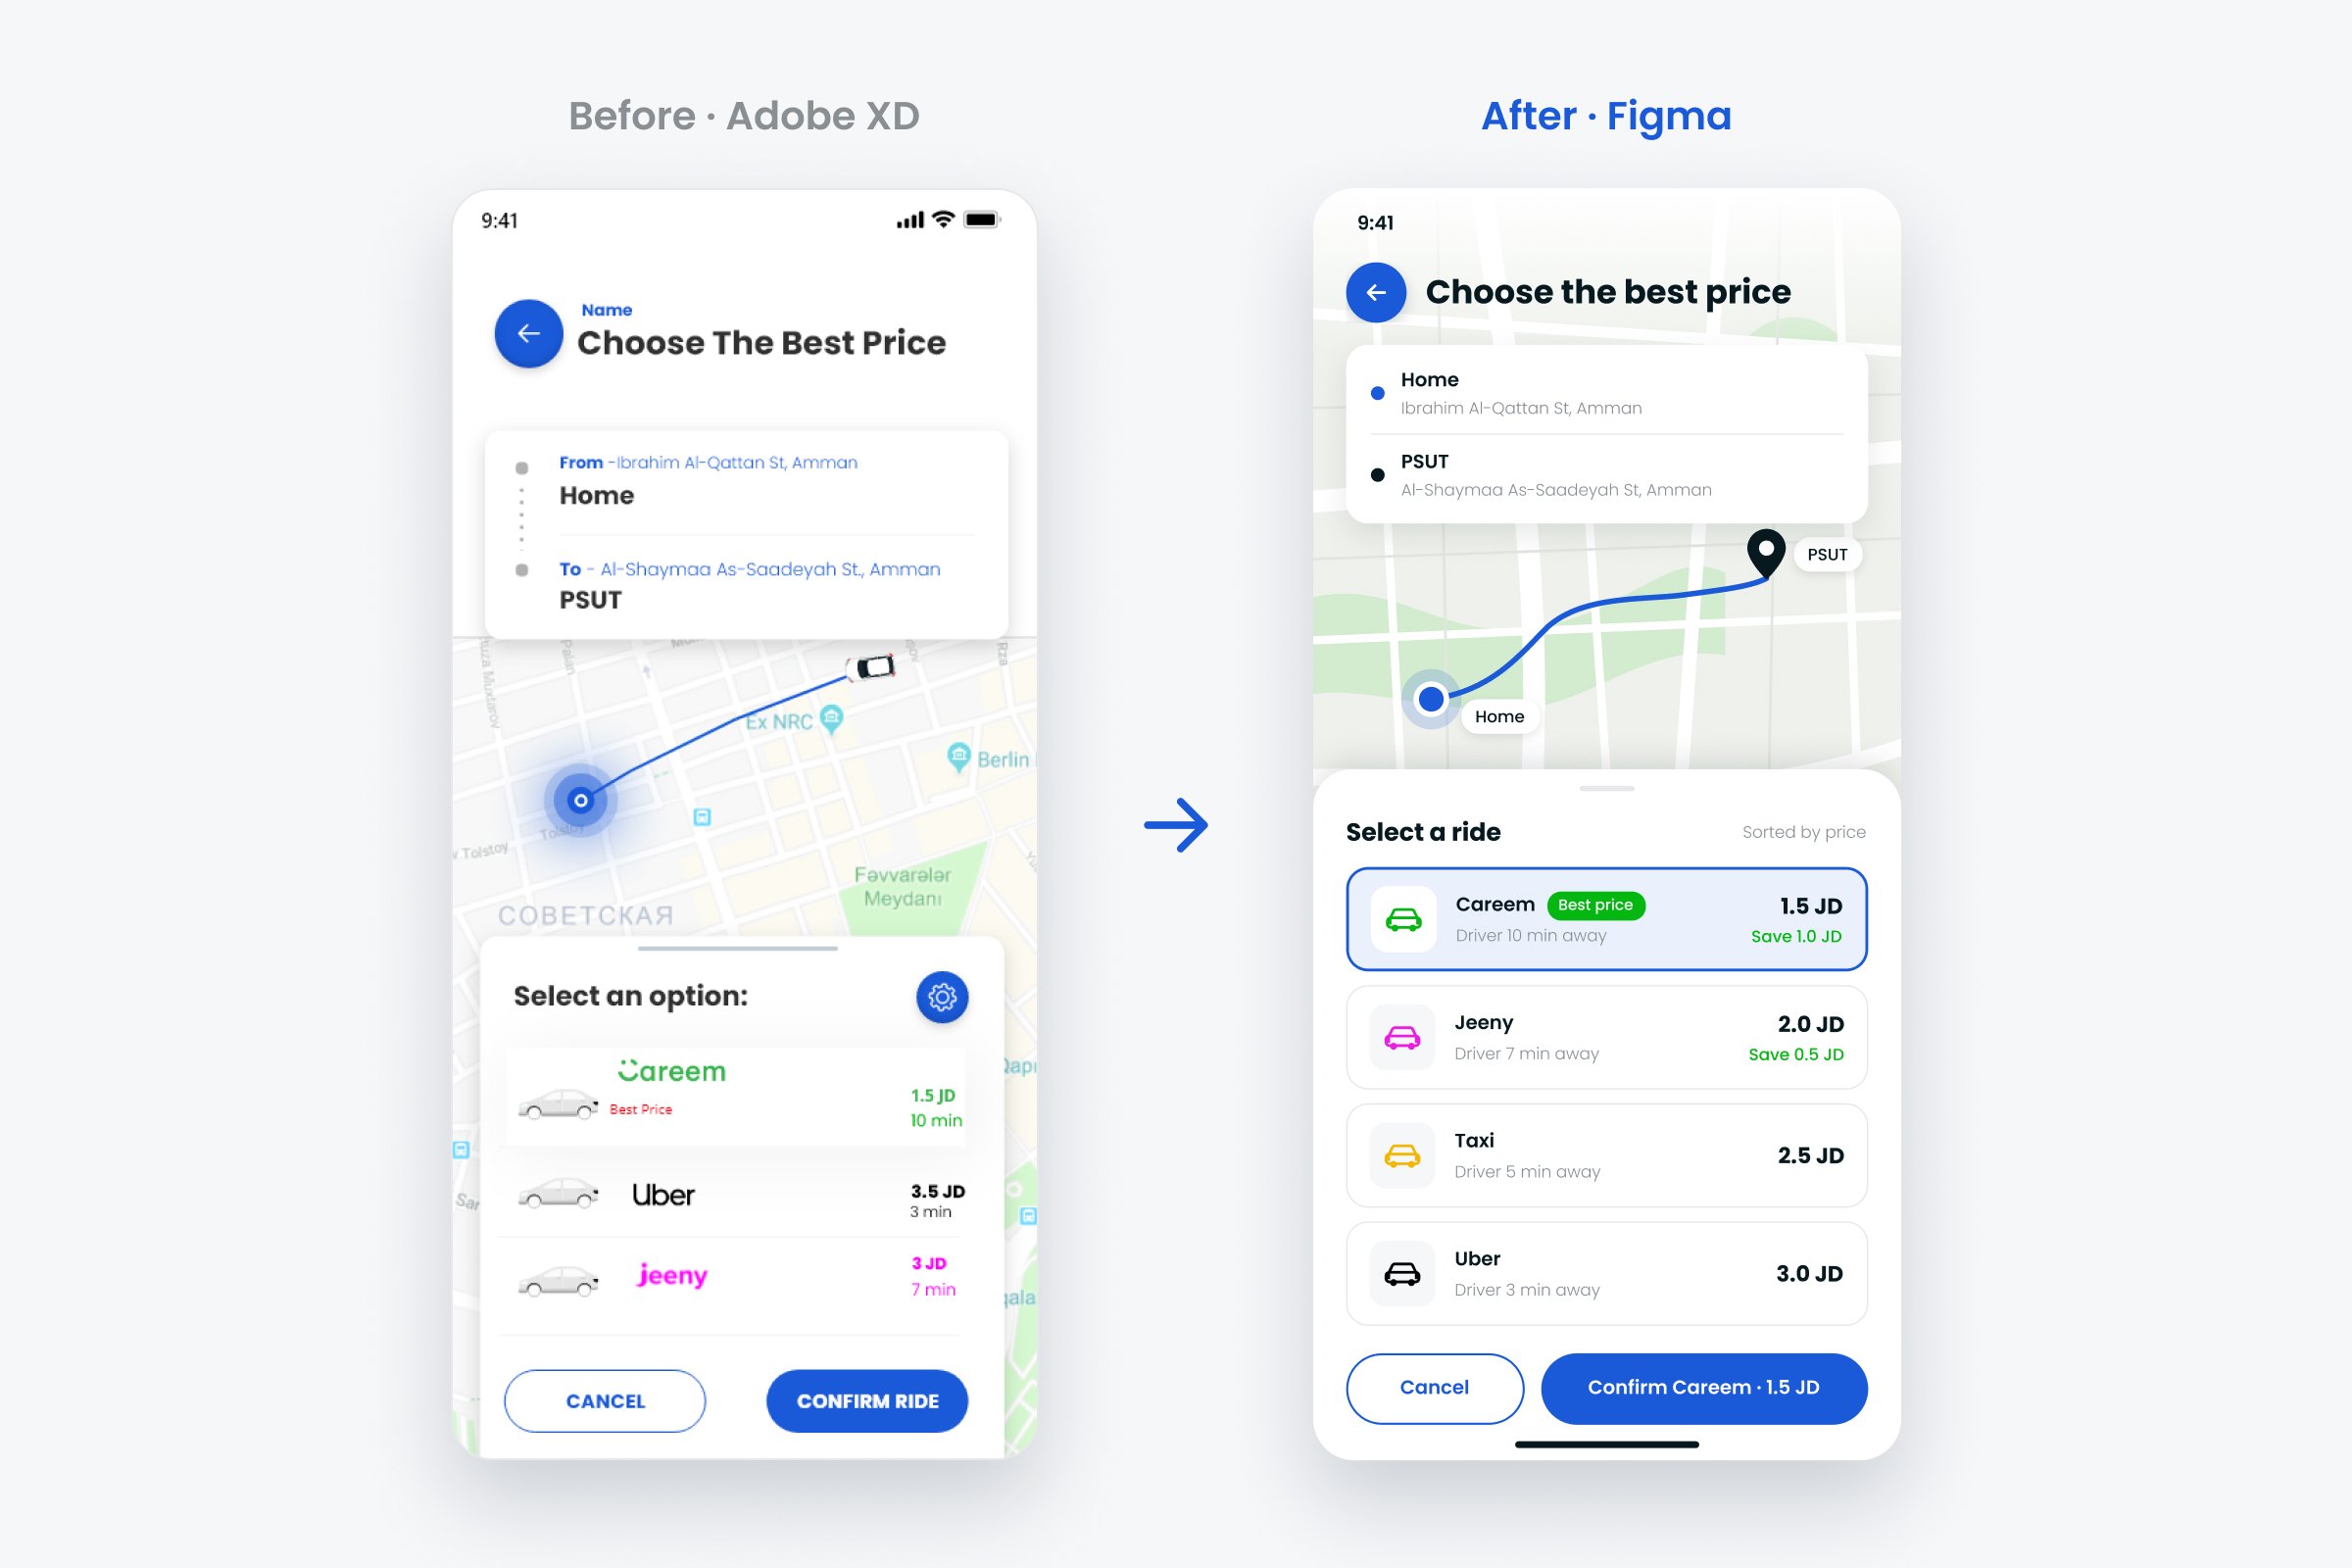
- Rides are sorted by price, and the cheapest is marked “Best price”The answer to “which one?” is always at the top.Compare
- Each option shows what you save, before you book“Save 1.0 JD” sits under the price, so the value is clear at the moment of choice.Saving
- The button names the choice: “Confirm Careem · 1.5 JD”No guessing what you're about to book, or for how much.Compare
- Provider names stay as plain text, and only the car icon takes their colourThe list stays calm and easy to compare, and Fareq keeps its own identity instead of borrowing other brands'.Compare
- Arrival time became the headline on the driver screen“Arriving in 5 min” with a progress bar, then the driver.Confidence
- The driver card shows the car and its plate numberSo riders can spot the right car on a busy street.Confidence
- “Chat” and “Message” became Call and Message, and Cancel turned redTwo different actions, and a destructive one that's hard to tap by mistake.Confidence
- The savings screen leads with the weekly total and compares it to last weekLabelled bars highlight the best day, and “Fareq fee” became “You paid with Fareq”.Saving
The redesign
Choose the best price
Driver on the way
Weekly savings
Visual design
The redesign keeps the original blue and Poppins, and turns them into a small system in Figma:
- Colour variables for brand, text, surfaces, saving and danger, plus one colour per provider.
- Text styles in Poppins, from a 24 px heading down to 12 px captions.
- Components with variants: a Button (primary and secondary) and a Provider Row (default and selected) whose name, price, ETA and badge can be changed without detaching.
- Green means saving, and only saving, so riders learn to look for it.
What I'd test next
The redesign hasn't been tested with riders yet. I'd start with 5 students who commute to PSUT, ask them to book the cheapest ride home and then find out how much they saved this week, and look at:
- Whether “Best price” is enough, or riders also want the fastest option marked.
- Whether showing the saving before booking actually changes which ride people pick.
- Whether anyone looks for the savings screen on their own, and how they'd expect to reach it.
How I'd measure success
Fareq only works if people book through it instead of opening the other apps. If it launched, I'd track:
- Compare to book: the share of price comparisons that end in a booking. This is the main number for the app, and the clearest test of the price picker.
- Time to book: seconds from entering a destination to confirming a ride, compared with checking three apps by hand.
- Picking “Best price”: how often riders choose the top option. If many skip it for a faster ride, the list needs a “Fastest” label too.
- Coming back: how many riders book again within 30 days, and whether people who open the savings screen come back more often than those who don't.
What I learned
The app exists to save money, so the saving has to be visible at every step, not only at the end.
Trying four layouts for one screen made the final choice easy to explain. Going back to my own work also showed me how much placeholder text hides: until the screens had real names, prices and places, it was hard to tell whether they worked. Next, I'd design the Arabic right-to-left version.