Overview
Scavenger is an open-source intelligence (OSINT) tool that helps analysts follow Arabic social media, spot fake and bot-like accounts, and see where coordinated activity comes from.
I named the product, designed its logo and designed the full interface in 2021 as part of a university project team. The research and the models behind the tool were built by a separate team; my work covered the brand and everything an analyst sees. In 2026 I rebuilt it in Figma around the questions analysts actually ask.
Where it started: the 2021 design
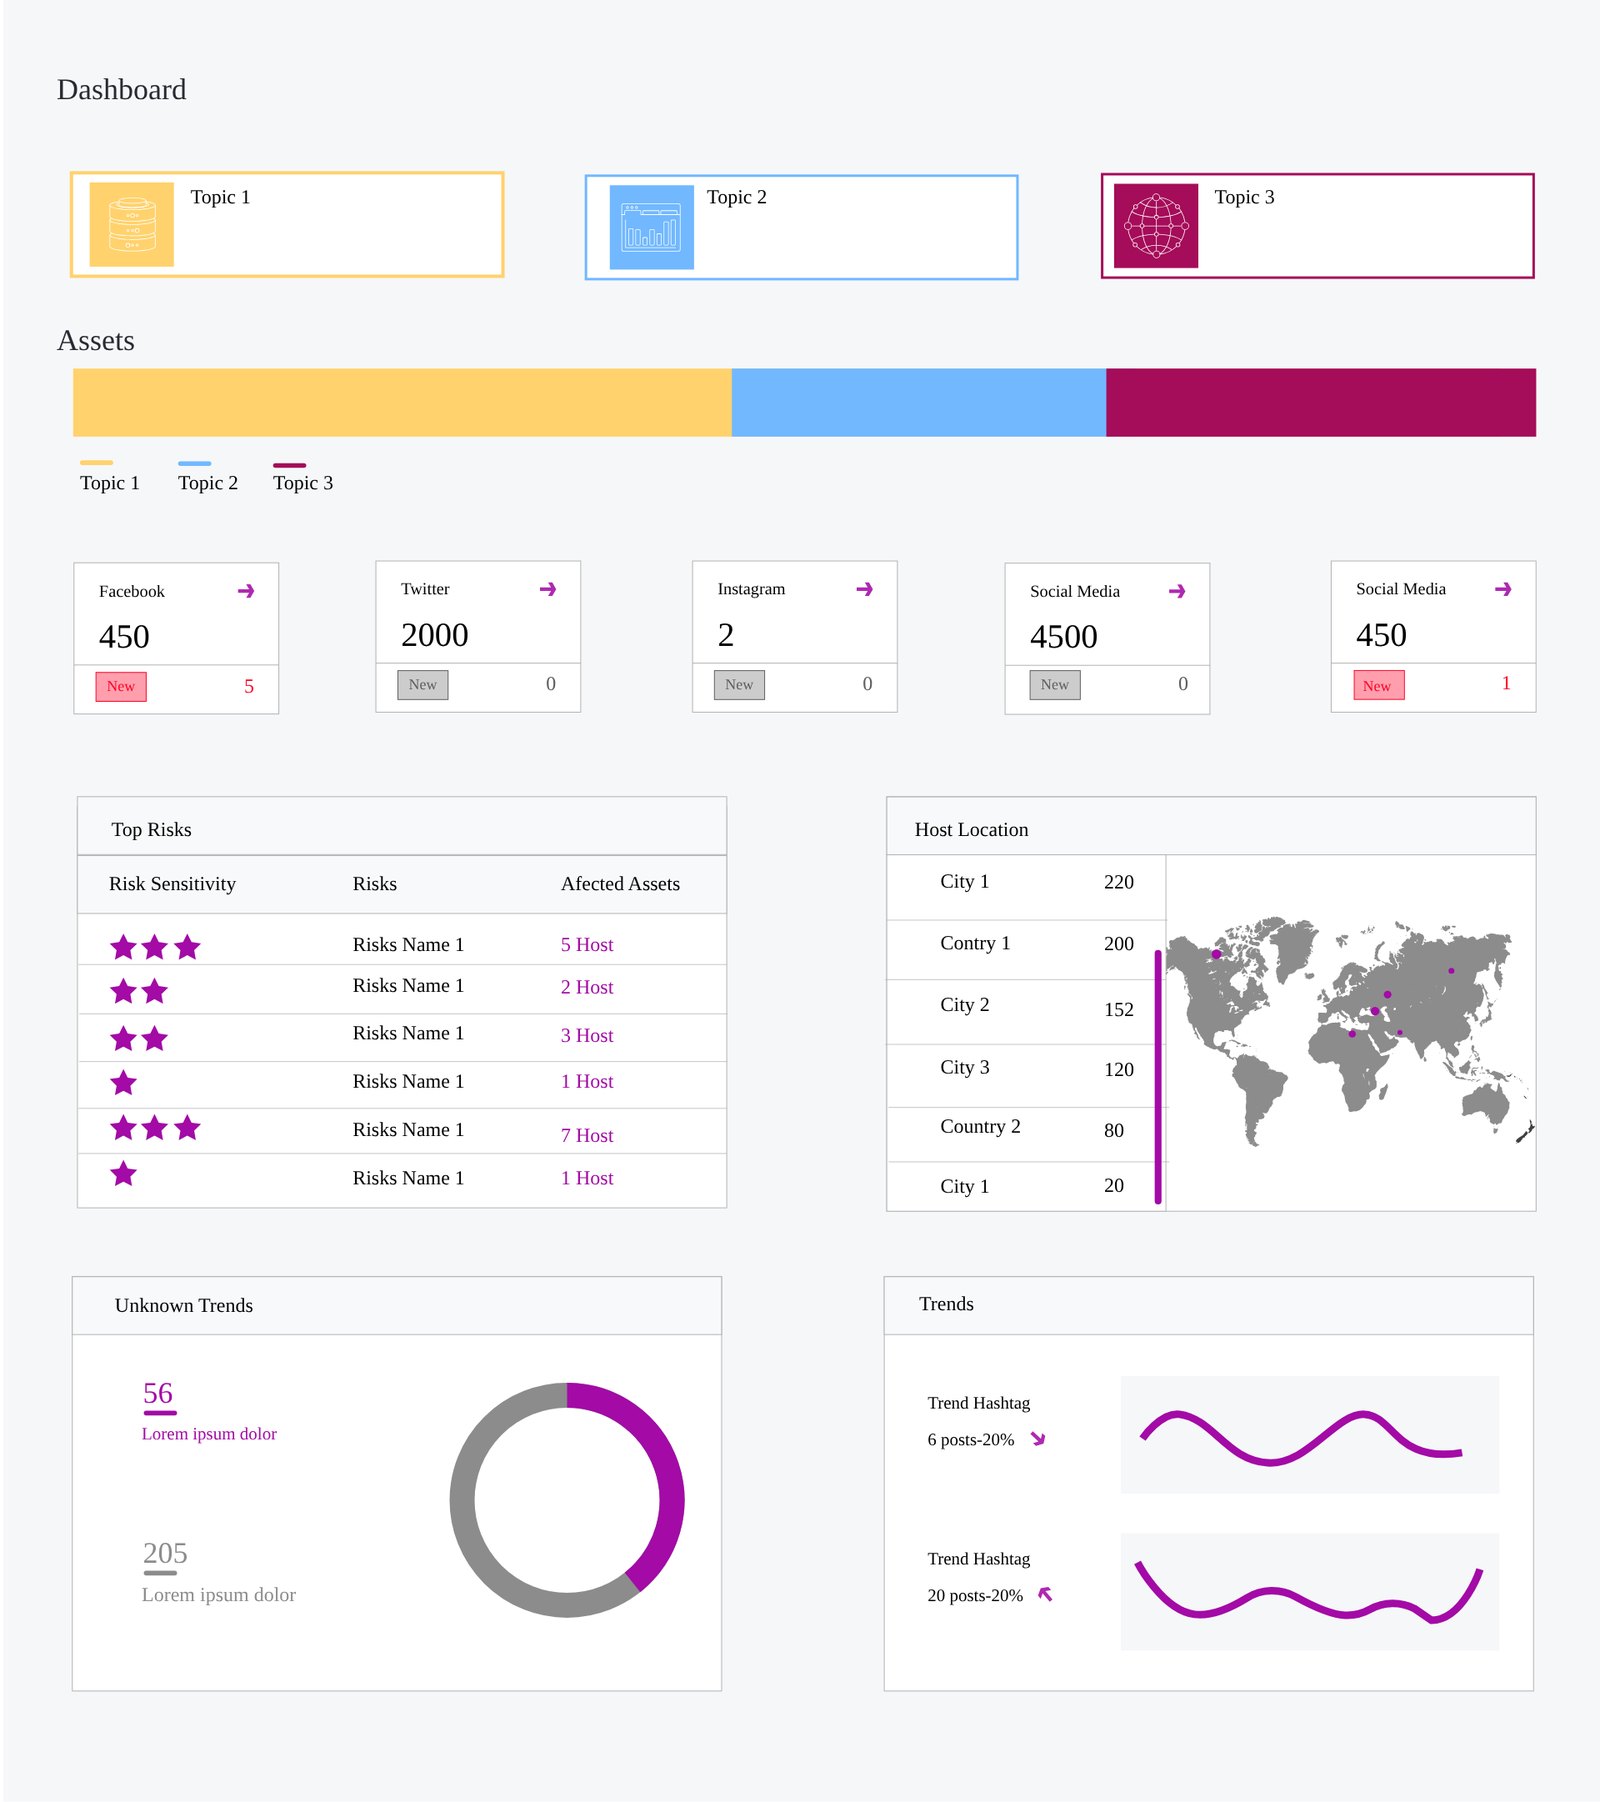
- Placeholder content“Slogan”, “Topic 1, 2, 3” and “Risks Name 1” hid what the tool was actually for.
- A marketing landing pageAnalysts log in and go straight to work. A slogan and a hero image only slowed them down.
- Stars for riskStars read as quality, not danger, and gave no reason why something was risky.
- Cases in a carouselOnly three cases showed at a time, with no status, so comparing them meant clicking through.
- An inconsistent shellThe top menu changed between screens, and typos and glossy buttons made it feel unfinished.
The building blocks were sound, though. Cases with their own colours, platform counts, top risks, locations, trends and the scan form all stayed. The redesign changed how each one answers a question.
The problem
Public conversation in the region happens on many platforms at once, and much of it is in Arabic. A single hashtag can be pushed by hundreds of new or automated accounts, which makes a small campaign look like a public movement. Analysts needed one place to:
- collect public posts by keyword, hashtag and platform,
- see which accounts look fake or bot-like, and why,
- tell real trends from coordinated ones,
- and see where the activity comes from.
Designing around the analyst's questions
The main users are analysts on a monitoring team who watch a handful of cases every day and explain what they find to people who never open the tool. I ordered the product around the questions they ask, in the order they ask them.
| The analyst asks | Where Scavenger answers it |
|---|---|
| What's happening right now? | Dashboard: active cases and posts collected per platform |
| Is it growing? | Dashboard: trending hashtags with their trend lines |
| Is it real or coordinated? | Dashboard: the share of each trend coming from flagged accounts, and account sources |
| Who is behind it? | Dashboard: top risks · Case results: flagged accounts and the reason for each flag |
| Where is it coming from? | Dashboard: account locations on a map |
| How do I track something new? | New case: a 4-step scan setup |
Goals
Scannable
An analyst should understand the state of every case in a few seconds, without opening anything.
Explainable
Every flag says why. An analyst has to defend a finding, so “high risk” alone is never enough.
Bilingual
Arabic and English keywords, hashtags and posts sit side by side and each reads in its own direction.
How I worked
- Review the 2021 screensWhat to keep, what broke, and why
- Map the analyst's questionsAnd give each one a place
- Greyscale wireframesFour screens with realistic example data
- Brand UI and colour system36 Figma variables, shared components
- Clickable prototypeFive screens linked from login to results
The flow
Key design decisions
- The dashboard reads top to bottom in the order of the analyst's questionsCases, then volume by platform, then risks and locations, then sources and trends.Scannable
- “Topic 1, 2, 3” became named cases with a statusEach case keeps its 2021 colour, now with a name, an icon, a post count and Active or Paused.Scannable
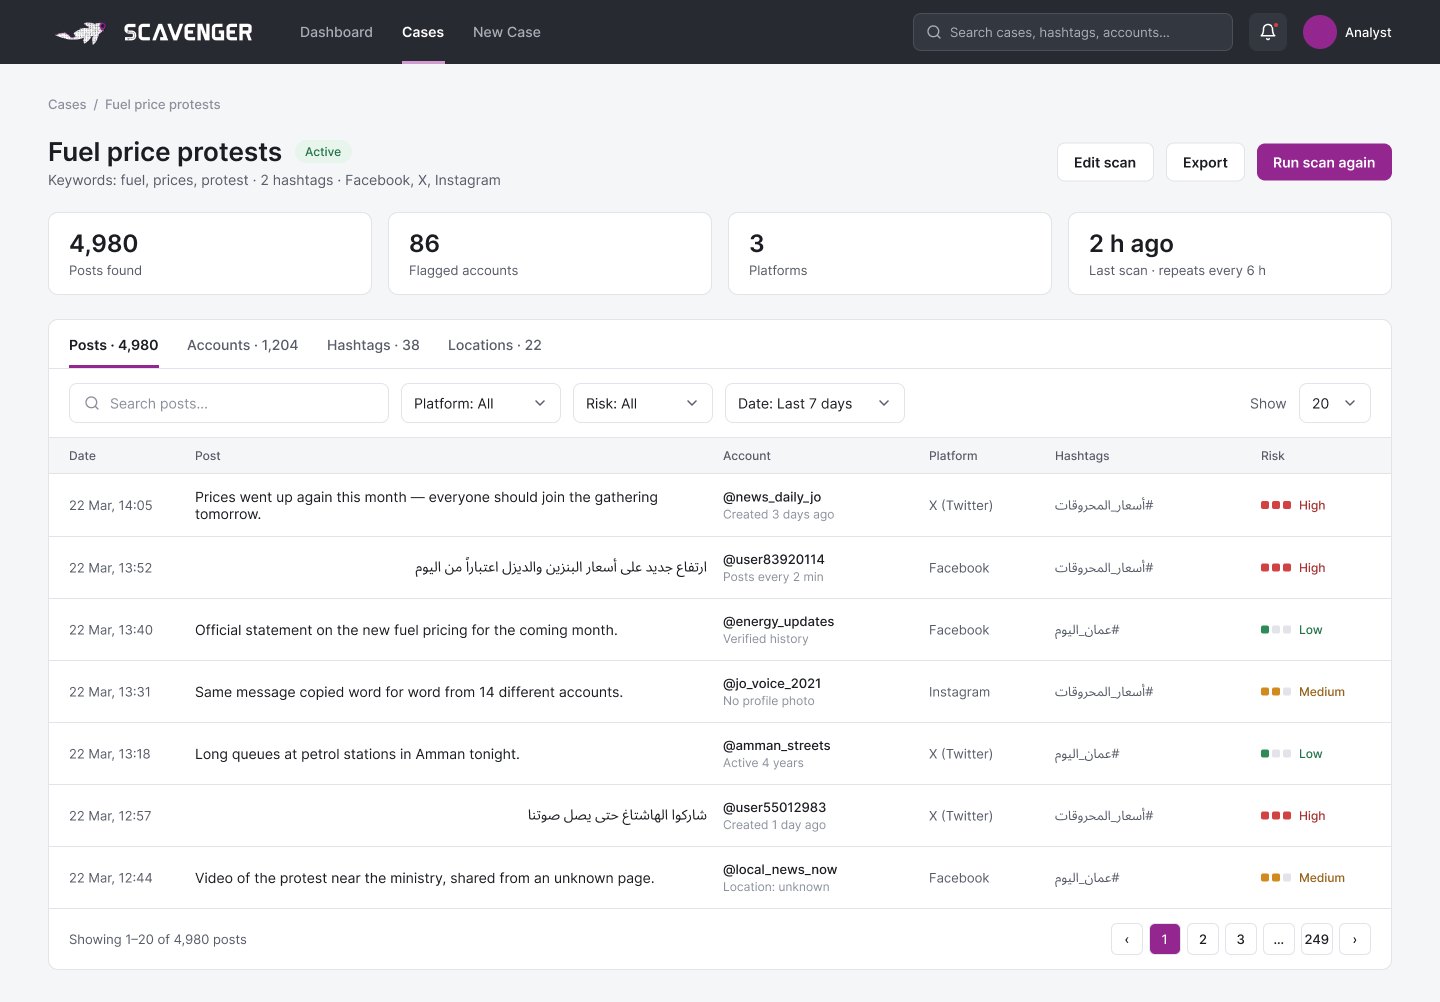
- Stars became High, Medium and Low riskEach level has a colour, a word and a number of filled dots, so colour is never the only signal.Explainable
- Every flagged account says why“Created 3 days ago”, “Posts every 2 min”, “No profile photo”: the reason sits right under the account name.Explainable
- Trending hashtags show how much comes from flagged accountsA trend driven 71% by suspicious accounts is the real finding, not the post count.Explainable
- The cases carousel became a gridStatus, posts, flagged accounts, platforms and last scan for every case, side by side.Scannable
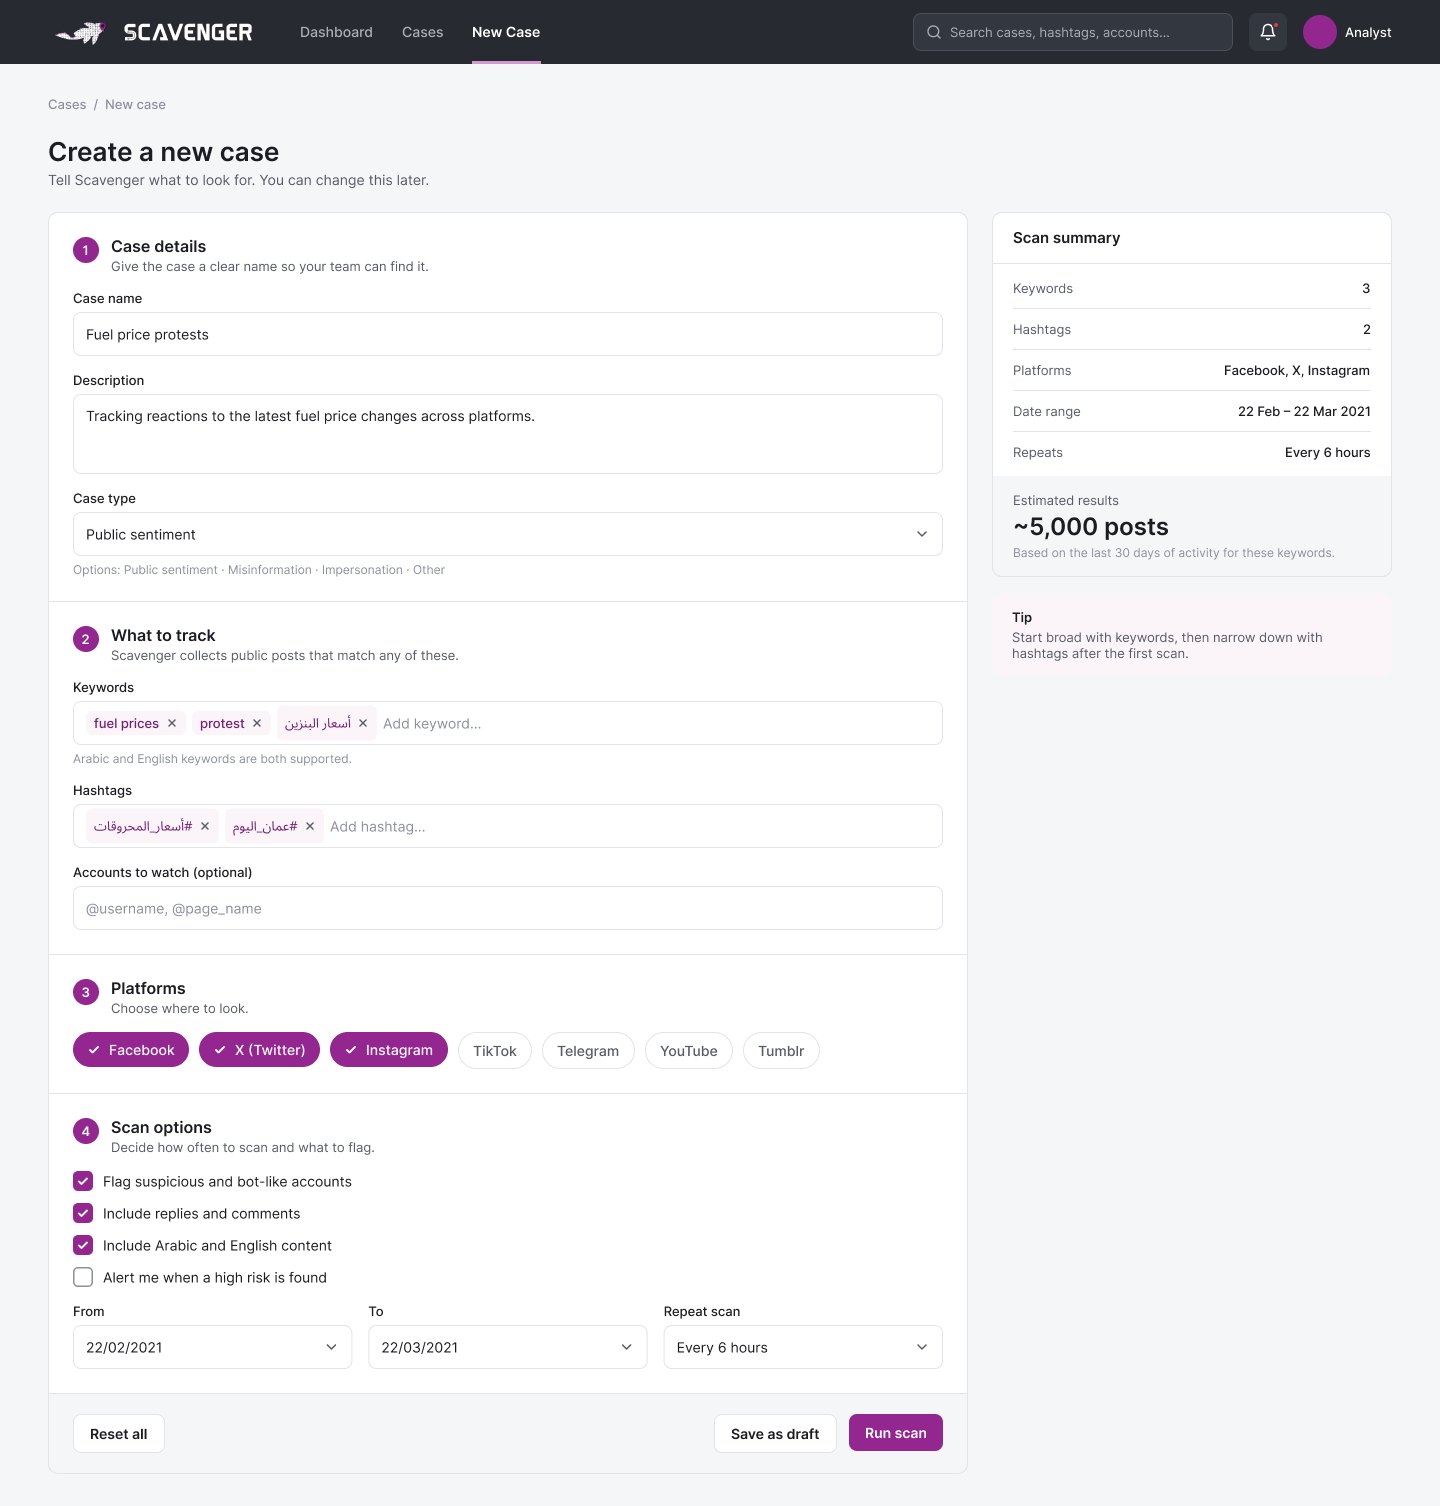
- The scan form became four numbered steps with a summaryCase details, what to track, platforms and options, with an estimate of how many posts the scan will return.Scannable
- Arabic and English keywords live in the same fieldTags take either language, and Arabic posts in the results are right-aligned so they read naturally.Bilingual
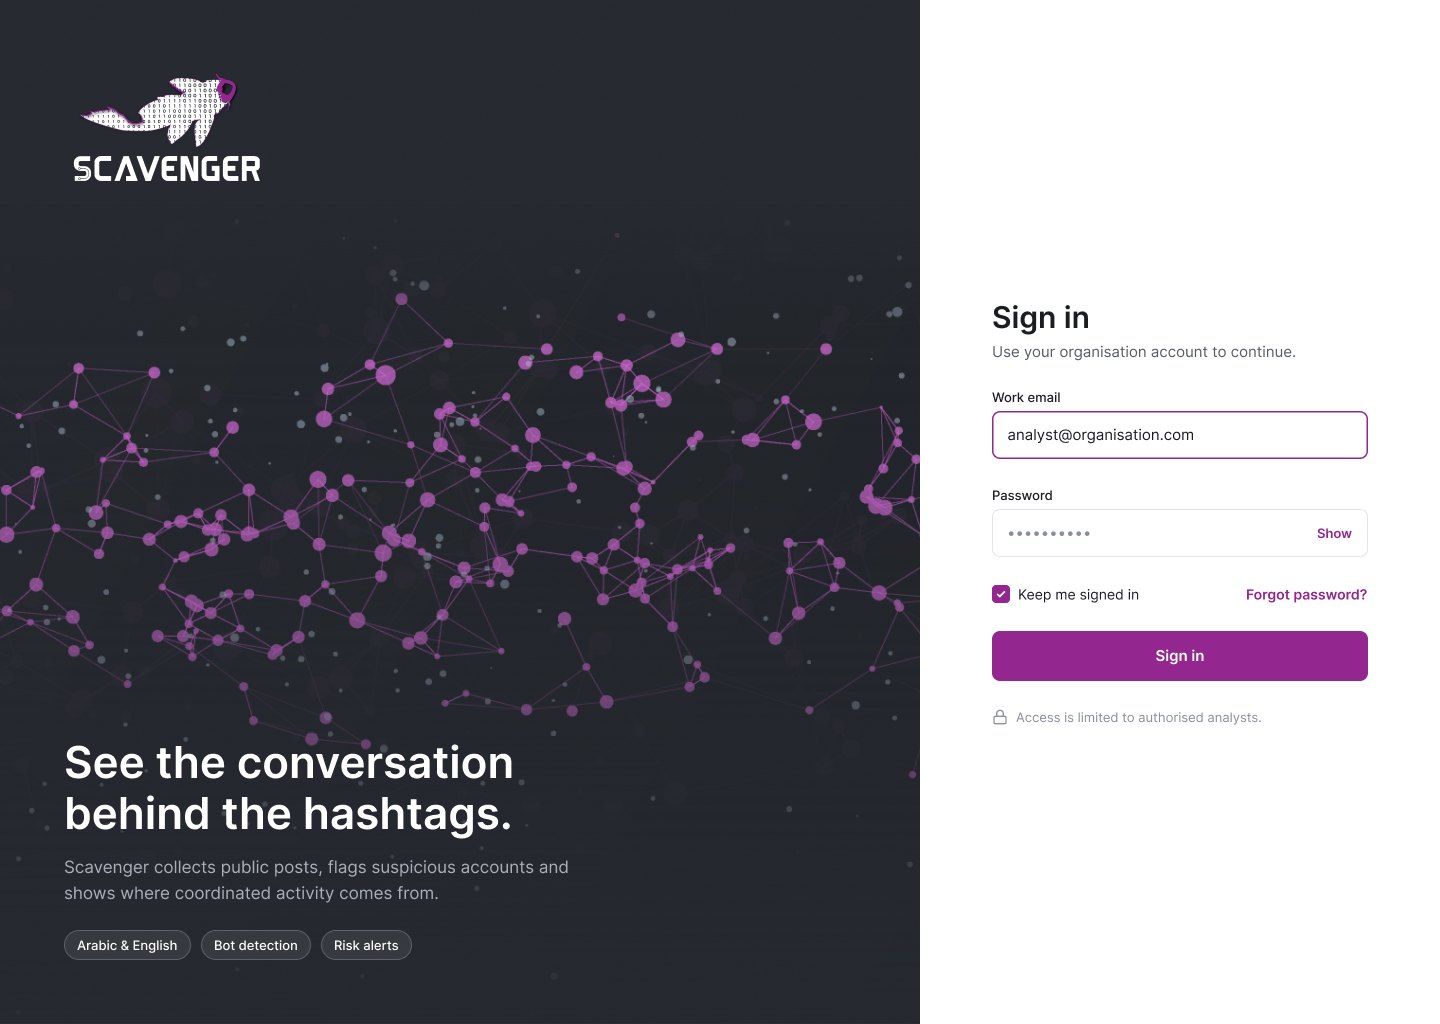
- The landing page became a sign-in screenThe network image the client asked for lives there, so the brand gets its moment without competing with the data.Scannable
The redesign
Wireframes first
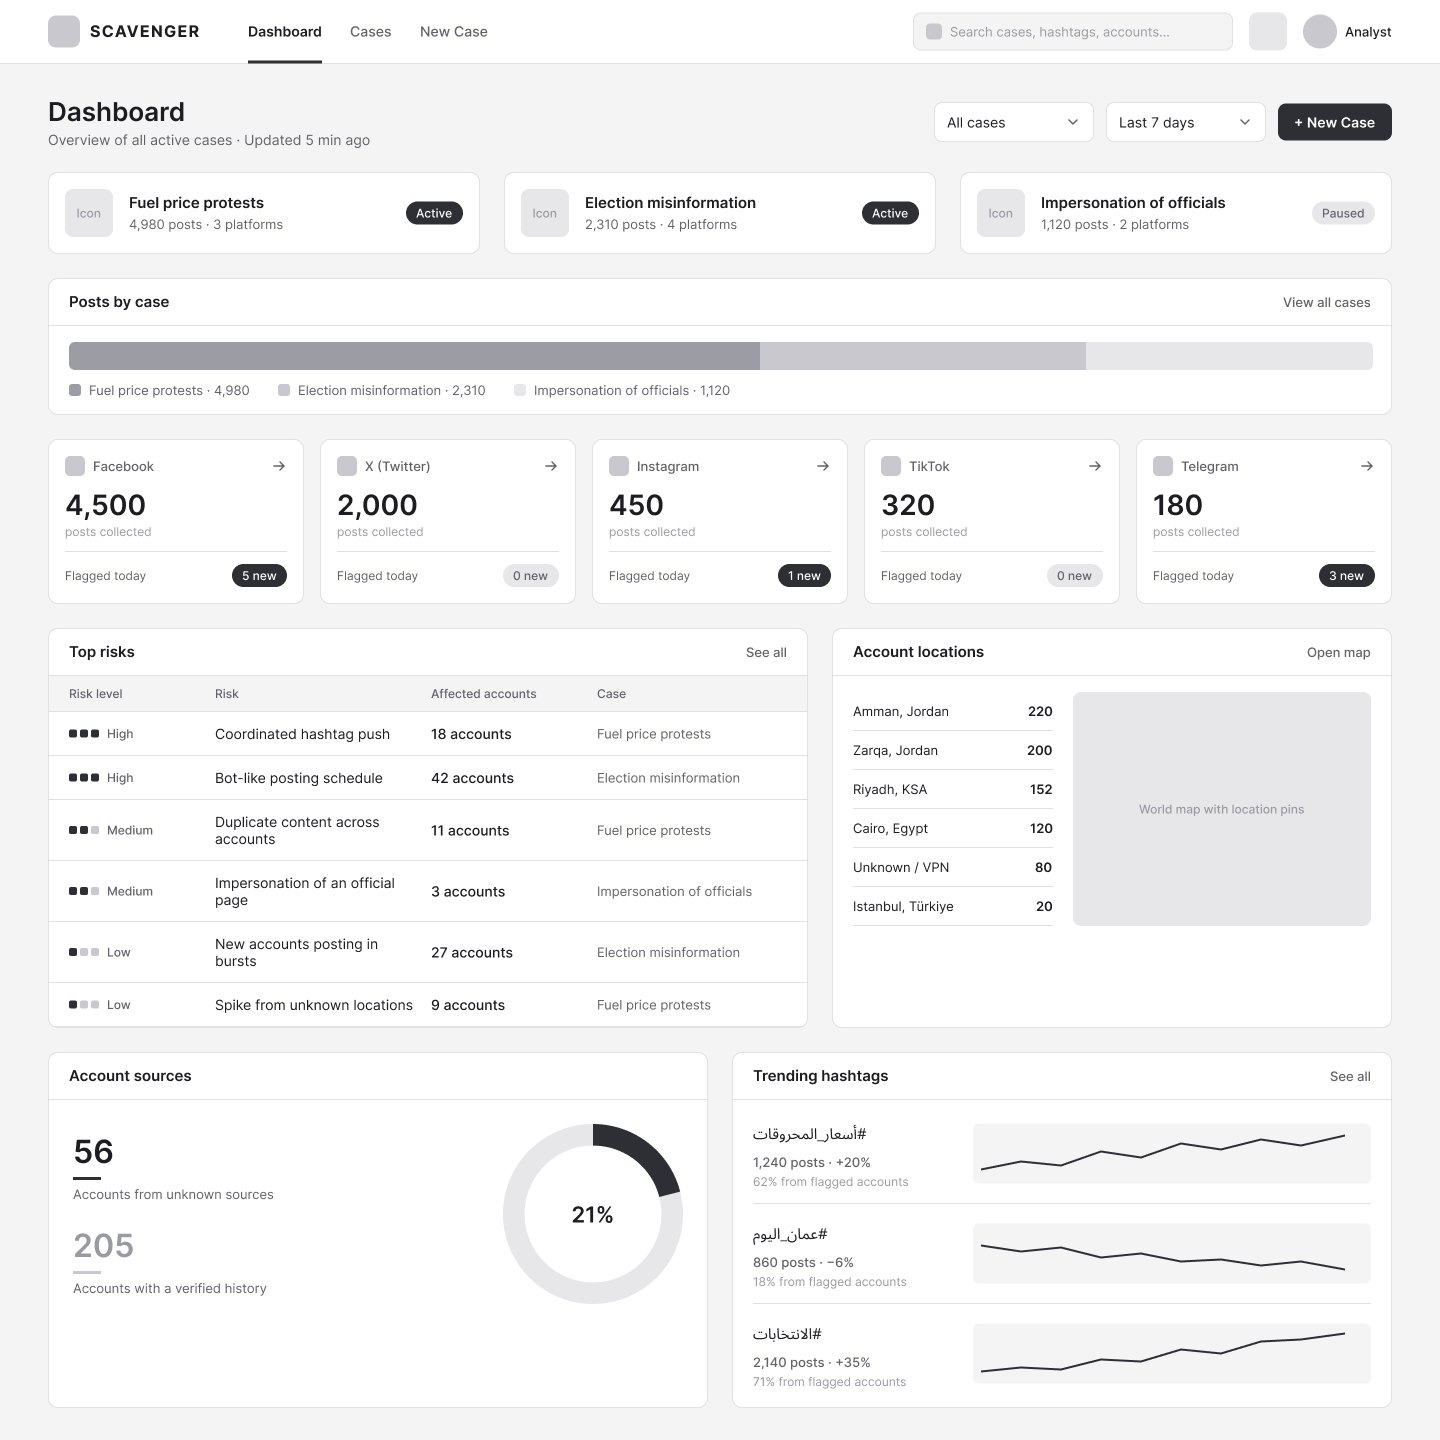
Dashboard
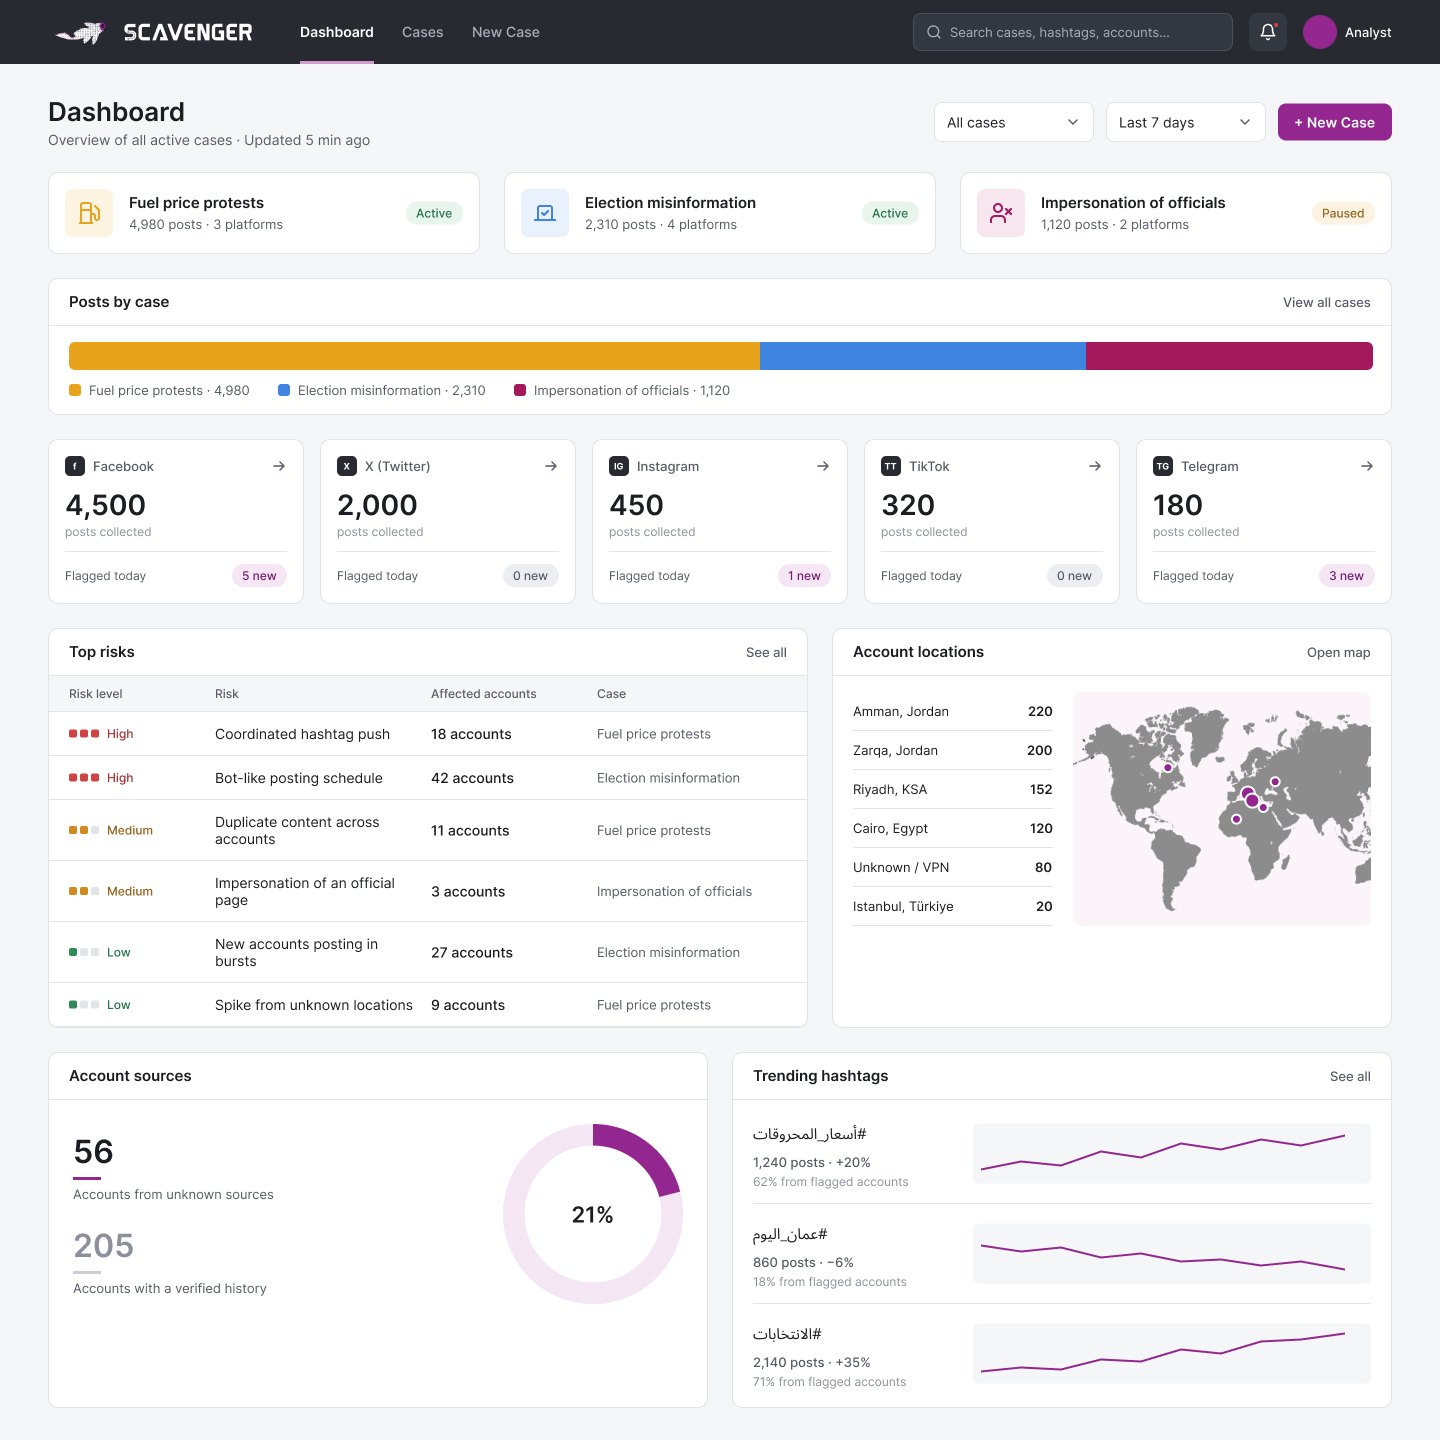
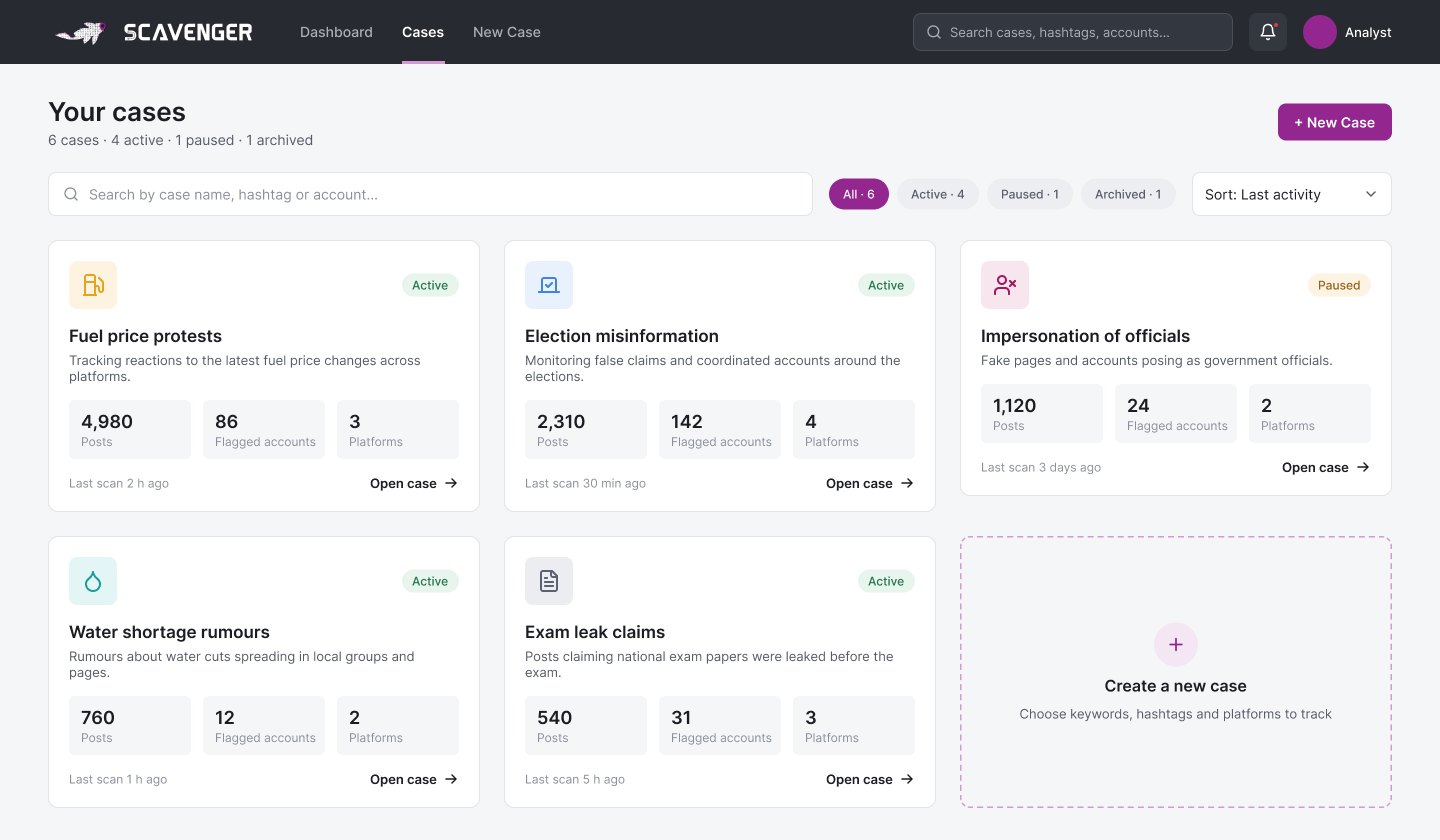
Visual design
The interface takes its colours straight from the logo, so the brand and the product feel like one thing.
- A navy top bar that matches the logo's background exactly, so the logo sits in the interface without a visible box.
- Purple for actions and active states. White on purple reaches about 7.2:1 contrast, and the muted nav text on navy about 6.5:1.
- Case colours carried over from 2021: yellow, blue and maroon, plus teal and slate for new cases.
- 36 colour variables in Figma for brand, neutrals, status and cases, with shared components for the top bar and buttons.
- Type: Inter for the interface and Noto Sans Arabic for Arabic posts and hashtags.
What I'd test next
The redesign hasn't been tested with analysts yet. My first round would be 3 to 5 analysts, each asked to find today's riskiest case, explain why one account in it was flagged, and set up a new case. I'd look at three things:
- Whether the dashboard order matches where analysts really start: with cases, or with alerts.
- Whether the flag reasons are enough for an analyst to trust, and defend, a finding.
- How long a new case takes to set up, and where people hesitate.
What I learned
Almost every module from the original survived. What changed is that each one now answers something specific, shows real content, and shares one colour system. Going back to my own early work also showed me how much a tool like this depends on explaining itself: a flag without a reason is just noise.
Next, I'd design an account detail view, the screen an analyst opens when an account is flagged, and a fully Arabic, right-to-left version of the interface.